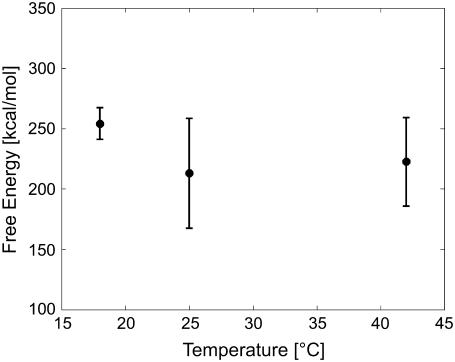
FIGURE 4.
Temperature dependence of the free-energy profile of BR unfolding. The average free-energy difference between folded and unfolded states is plotted as a function of temperature (18°C, 25°C, and 42°C; examined at an extension of 70 nm) and the corresponding mean (solid line). Error bars were obtained by averaging over different pulling rates at each temperature.

