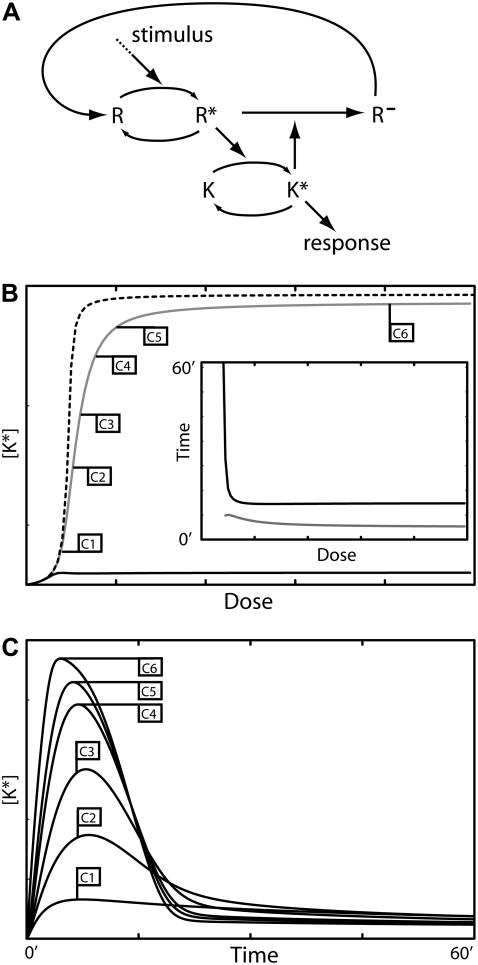
FIGURE 6.
Model IV B—feedback desensitization. (A) Schematic diagram of the model. (B) Dose response curves for K*: maximum amplitude with negative feedback (shaded curve) and without (dashed curve) and the steady-state level with negative feedback (solid curve). (Inset) Signal duration (solid curve) and time to maximum amplitude (shaded curve). (C) Time series for [K*] using the stimulus levels indicated in panel B. The model equations and parameter values used to generate this figure are given in Appendices and Table 1.

