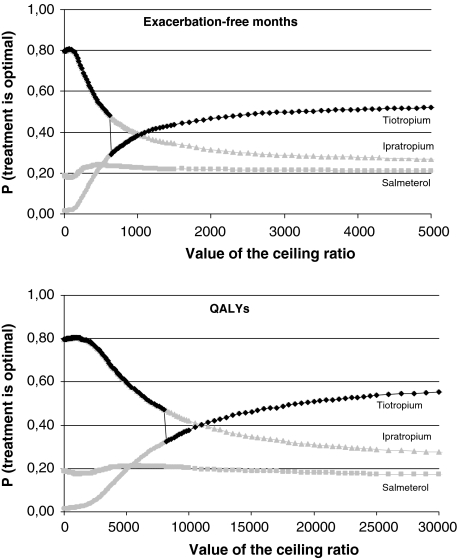
Fig. 2.
Cost-effectiveness acceptability curves and frontier of the costs per exacerbation-free month and the cost per QALY. Ceiling ratio: threshold value for the cost-effectiveness ratio in euros. The curves in grey represent the probability that a treatment is cost effective for a given value of the ceiling ratio. In the case of skewed distributions of the ratio, the treatment with the highest probability of being cost effective is not always the treatment with the highest expected net benefit. The acceptability frontier (in black) shows which treatment is associated with the highest expected net benefit for each value of the ceiling ratio

