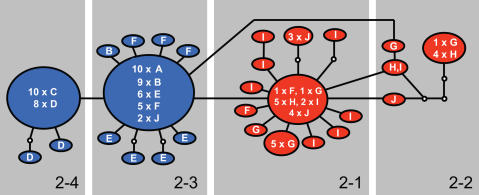
Figure 2. Network of Nassarius kraussianus haplotypes.
A statistical parsimony haplotype network constructed from combined partial mtDNA COI and 16S rDNA sequences of N. kraussianus. Haplotypes shown in blue were mostly found in the western portion of the species' geographical range (localities A–F; Fig. 1) and those in red were mostly found in the eastern portion of its range (localities G–J). Haplotypes are represented as ovals, with sizes being proportional to a haplotype's frequency. Letters within ovals indicate in which sampling localities a particular haplotype was found and correspond to the letters in Fig. 1. Small white circles are interior node haplotypes not present in the samples. Grey areas around groups of haplotypes depict two-step nested clades.

