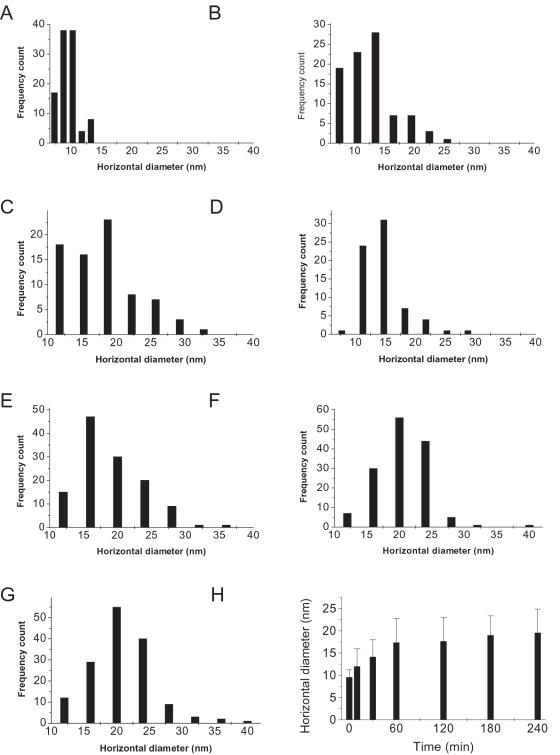
Figure 4. Changes in horizontal diameters of tau at different time intervals in 0.1% formaldehyde solution.
The frequency counts of the horizontal diameters of tau protein at different incubation time (A–G) are based on the AFM images shown in Figures 3A–G, respectively. The mean values are summarized in H.

