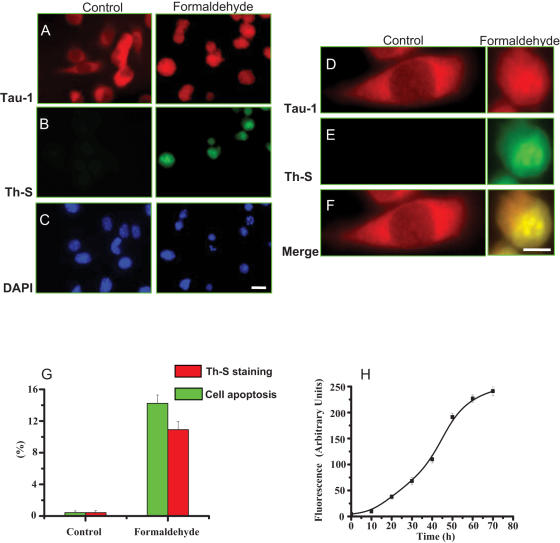
Figure 9. Tau aggregation in SY5Y cells in the presence of formaldehyde.
SY5Y cells were cultured and incubated with 0.0005% formaldehyde for 72 h. Immunolabelling with the monoclonal antibody Tau-1 was used to visualize tau expression (A) and thioflavin S was to detect tau aggregates in the cells (B). Cells stained with DAPI showed apoptotic cells with the shrunk nuclei (C). Bar: 50 µm. D–F (magnified from A and B, Bar: 25 µm) show that the signals of ThS (amyloid-like aggregates) and the monoclonal antibody Tau-1 overlap each other in the cells. Quantitative results of protein tau aggregation and cell apoptosis are shown in G. Fluorescence intensity of tau aggregation stained by ThS during time course is shown in H.

