
Fig. 7.
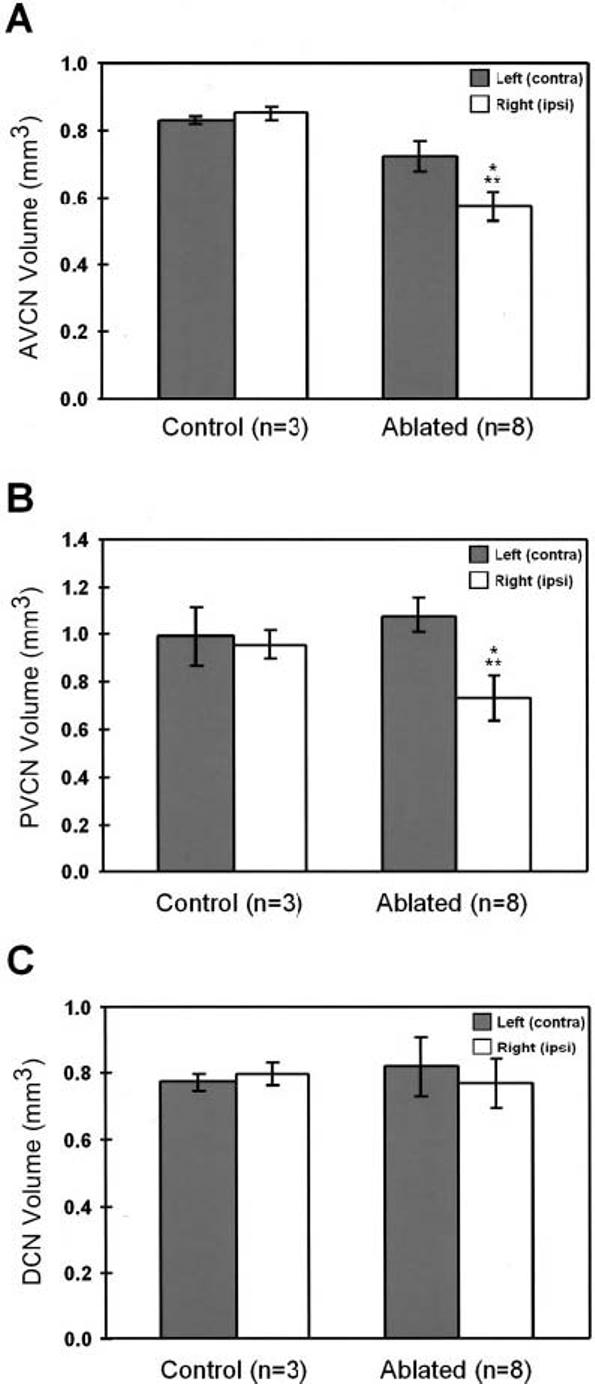
Bar graphs showing the mean volume of the left and right anterior ventral cochlear nucleus (AVCN), posterior ventral cochlear nucleus (PVCN) and dorsal cochlear nucleus (DCN), in control and ablated ferrets. There was a significant decrease in the AVCN (A) and PVCN (B) volume ipsilateral to the ablation compared to both the contralateral side and unoperated animals. However, no significant differences were found in the DCN (C) either between sides or animal groups. Error bars indicate standard deviation. (*), indicates significant differences between sides (P<0.05); (**), indicates significant differences between groups (P<0.05).