
Figure 2.
Autoradiograms demonstrating expression of 5-HT7 receptor mRNA and calbindin mRNA in the same region of the hamster SCN. The red traces represent the border of the calbindin mRNA expression. Scale bar depicts 500 microns.
Official websites use .gov
A
.gov website belongs to an official
government organization in the United States.
Secure .gov websites use HTTPS
A lock (
) or https:// means you've safely
connected to the .gov website. Share sensitive
information only on official, secure websites.
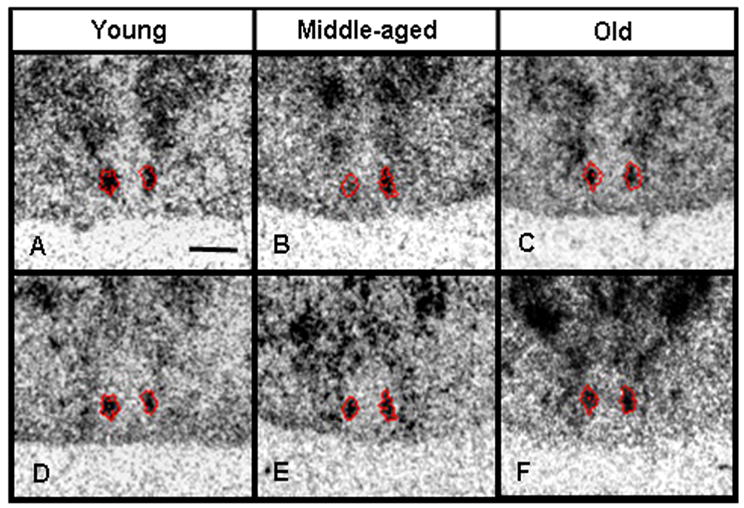
Autoradiograms demonstrating expression of 5-HT7 receptor mRNA and calbindin mRNA in the same region of the hamster SCN. The red traces represent the border of the calbindin mRNA expression. Scale bar depicts 500 microns.