
Figure 1.
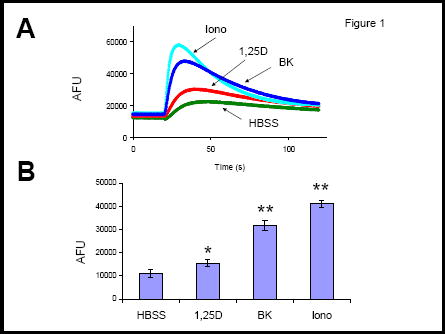
Calcium signals in ROS 17/2.8 cells. A:Changes of intracellular Ca2+ concentration as a function of time during the addition of saline (control, HBSS), 10 nM 1,25D, 0.5 μM S(-) Bay K8644, or 2 μM ionomycin. Traces correspond to arbitrary fluorescence units (AFU) measured in separate wells. Agents were delivered at the point of deflexion of the traces. B: Values obtained for the increase in AFUs calculated as the difference between the peak of maximum fluorescence and initial baseline value for each treatment. *, p<0.05; **, p<0.01; n=3. HBSS composition: 5.4 mM KCl, 0.3 mM Na2HPO4, 0.4 mM KH2PO4, 4.2 mM NaHCO3, 1.3 mM CaCl2, 0.5 mM MgCl2, 0.6 mM MgSO4, 137 mM NaCl, 5.6 mM glucose, pH 7.4.