
Figure 3.
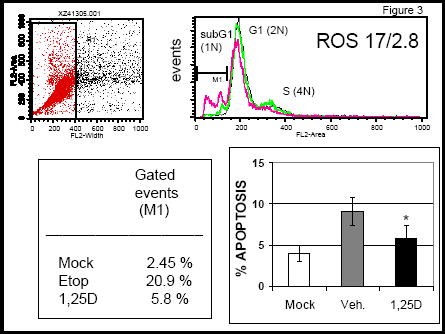
Apoptosis values measured in ROS 17/2.8 cells in the absence and presence of 10 nM 1,25D. Upper panels: Flow cytometry analysis of cell populations before induction of apoptosis (mock), after induction of apoptosis with 100 μM etoposide, and in the presence of 10 nM 1,25D. Apototic cells fall in the gated M1 region of the curve. Left lower panel: Percent of apoptosis measured in the absence (Veh.) and presence of 10 nM 1,25D. *, p<0.05, for the difference between treatments.