
Figure 5.
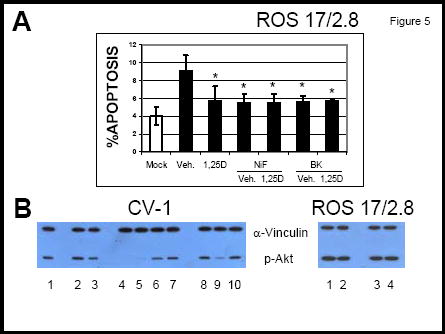
A: Percent of apoptotic cells measured after induction of apoptosis with 100 nM STSP. The reagents were added to the medium as described in the text. *, p<0.05, n= 3. B: Western blot analysis for the detection of p-Akt under the following conditions: (left panel) 1 and 8, vehicle (0.01% ethanol); 2, 10 nM 1,25D; 3, 100 nM 1,25D; 4, 10 nM 1,25D + 2 μM nifedipine; 5, 2 μM nifedipine; 6, 10 nM 1,25D + 2 μM thapsigargin; 7, 2 μM thapsigargin; 9, 10 nM 1,25D + 0.5 μM S(-) BayK 8644; 10, 0.5 μM S(-) BayK 8644; (right panel) 1, 0.5 μM Bay K8644; 2, 1 μM BayK 8644; 3, vehicle (0.01% ethanol); 4, 2 μM nifedipine.