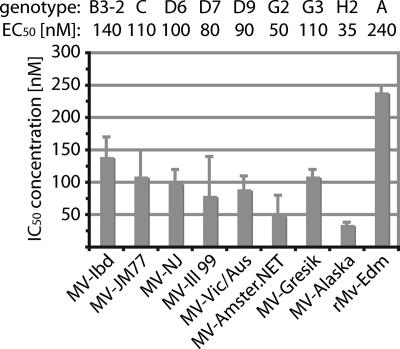
FIG. 7.
16677 is active against a panel of clinical MV isolates. Dose-response curves were generated on the basis of virus yields determined by TCID50 titration, and EC50s were calculated. Viral genotypes are given above the graph. Averages of two experiments are shown, and the error bars represent standard errors of the mean (SEMs). For viruses MV-Alaska and rMV-Edm, the EC50s are based on three experiments and the error bars represent standard deviations.

