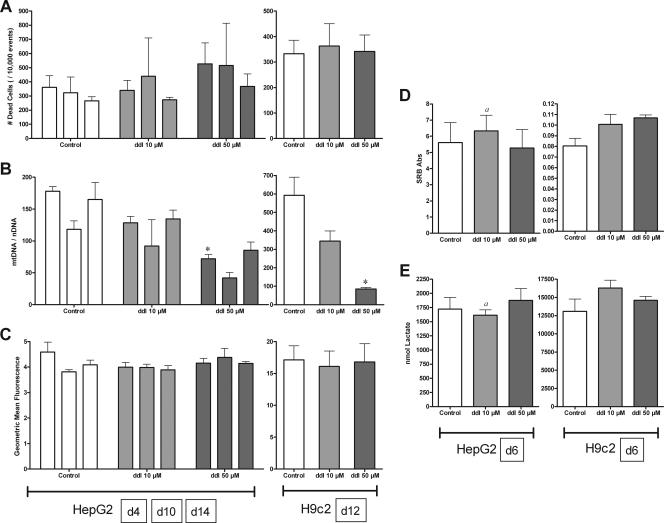
FIG. 4.
Effects of ddI (10 [light gray] and 50 [dark gray] μM) on HepG2 and H9c2 cells. HepG2 cells were treated for 4, 10, and 14 days (A to C) and 6 days (D and E); H9c2 cells were treated for 12 days (A to C) and 6 days (D and E). See the legend to Fig. 1 for panel descriptions. The data reported are the means of three separate experiments plus mean standard errors unless otherwise indicated. *, statistically different from time-matched control (P < 0.05). a, n = 2 due to insufficient material for analysis.

