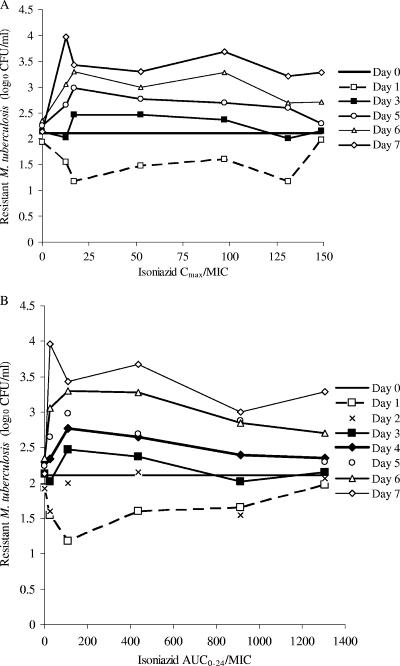
FIG. 5.
Relationship between concentration-dependent indices (Cmax/MIC, AUC/MIC) and the size of the resistant population. Shown are day-to-day changes in resistant population levels with respect to increases in the Cmax/MIC ratio (A) and the AUC0-24/MIC ratio (B). Each line represents the change in the resistant population with a change in the PK-PD index value on a particular day of therapy. Only data for the population with high-level resistance are shown; the pattern for low-level resistance curves is similar. Lines for some of the days, such as day 2, were not drawn for purposes of clarity.

