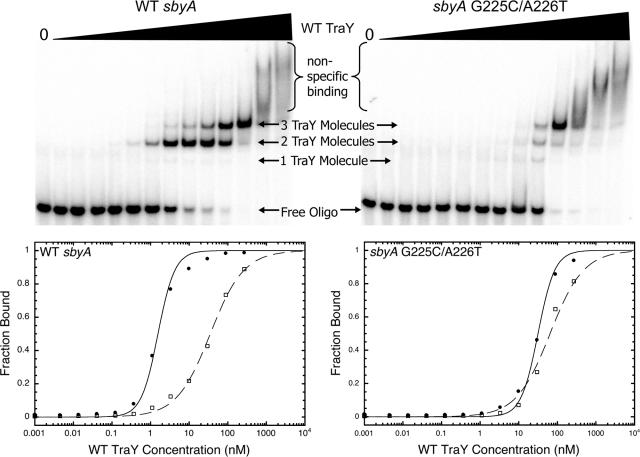
FIG. 2.
Representative EMSAs and graphs of TraY binding to WT and variant 39-bp sbyA binding sites. The upper panels depict TraY binding to the WT 39-bp sbyA binding site (upper left) or the G225C/A226T variant 39-bp sbyA site (upper right). The concentration of TraY increases from left to right (0 to 2.4 μM). The fastest migrating band illustrates free labeled DNA, whereas the slower migrating bands represent TraY bound to oligonucleotide. Smearing at the highest protein concentrations indicates nonspecific binding. Data from each EMSA were plotted as TraY concentration versus fraction bound. Each graph is displayed beneath its corresponding EMSA. TraY binding to WT and variant 39-bp sbyA oligonucleotides is plotted as two distinct binding events representing two TraY molecules binding the IR (filled circles) and a third molecule of TraY binding the alternative binding site (open squares). The IR data are fit with a two-site cooperative model, while the third bound TraY molecule is fit with a single independent binding site model.

