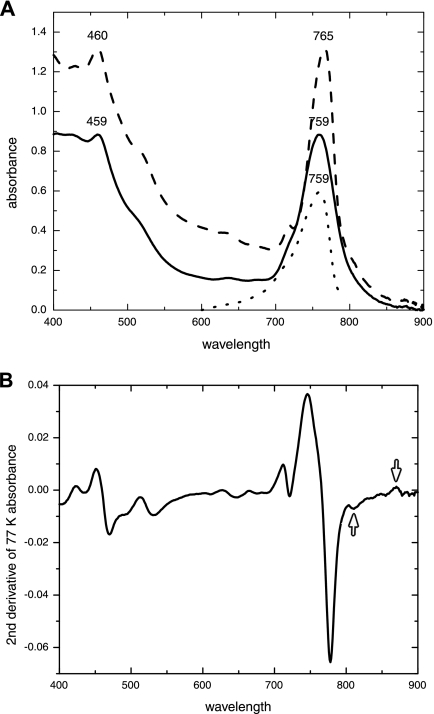
FIG. 2.
(A) Absorbance and fluorescence excitation spectra for whole cells of “Ca. Chlorothrix halophila.” The 459- and 759-nm peaks of the absorbance spectrum at room temperature (solid line) represent the BChl c in the chlorosomes. At 77 K (dashed line), the peaks are at 460 and 765 nm, there is a shoulder at 810 to 825 nm, and there is a small peak at 870 nm. The fluorescence excitation spectrum for whole cells (excitation wavelength, 825 nm) at 77 K (dotted line) has a fluorescence peak at 759 nm. (B) The second-derivative spectrum of the 77 K absorbance spectrum from panel A shows the small peaks at 810 and 870 nm (arrows).

