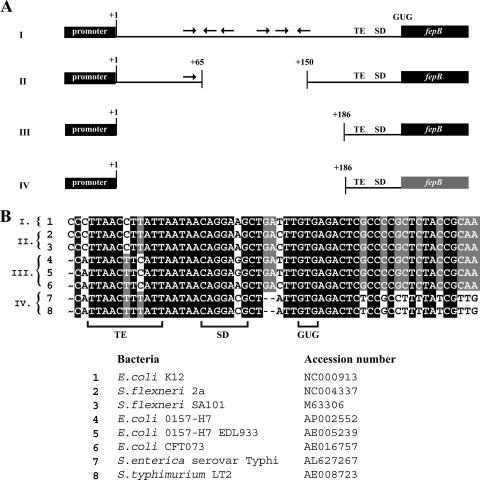
FIG. 3.
Genomic comparison of fepB leader regions. (A) Schematic representation of sequence data comparing the fepB leader regions of related bacteria. Genomic sequences of eight strains of gram-negative bacteria were grouped based on sequence conservation as follows: group I, E. coli K-12; group II, S. flexneri SA101 and S. flexneri 2a; group III, E. coli O157:H7, E. coli O157:H7 EDL933, and E. coli CFT073; and group IV, S. enterica serovar Typhimurium LT2 and S. enterica serovar Typhi. The black boxes and lines indicate nearly identical sequences. Increased variability in the fepB coding sequence of Salmonella sp. (group IV) is indicated by the gray fepB box. (B) Alignment of fepB TIR genome sequences. The TE sequence, SD sequence, and GUG start codon are indicated. Shading indicates the degree of conservation.

