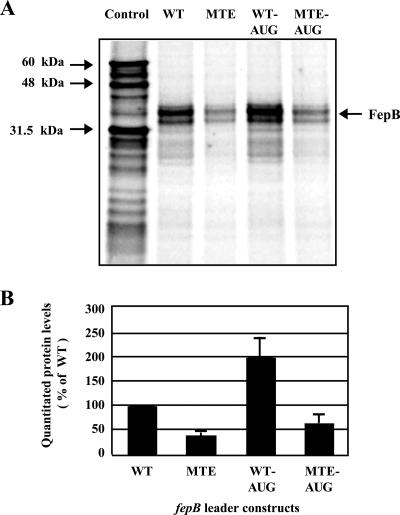
FIG. 5.
FepB levels assessed by in vitro transcription-translation. (A) SDS-PAGE of [35S]Met-labeled FepB protein produced by in vitro transcription-translation reactions. The band at approximately 34 kDa is consistent with FepB from which the signal sequence has been cleaved and which migrates just below unprocessed FepB. The control experiment resulted in several products, which were used as size markers (luciferase, 60.7 kDa; internal luciferase start, 48 kDa; and β-lactamase, 31.5 kDa). (B) Quantitation of protein levels. The bars indicate the averages of six experiments, and the data are expressed relative to the value obtained for the WT, which was defined as 100%. The error bars indicate standard deviations.

