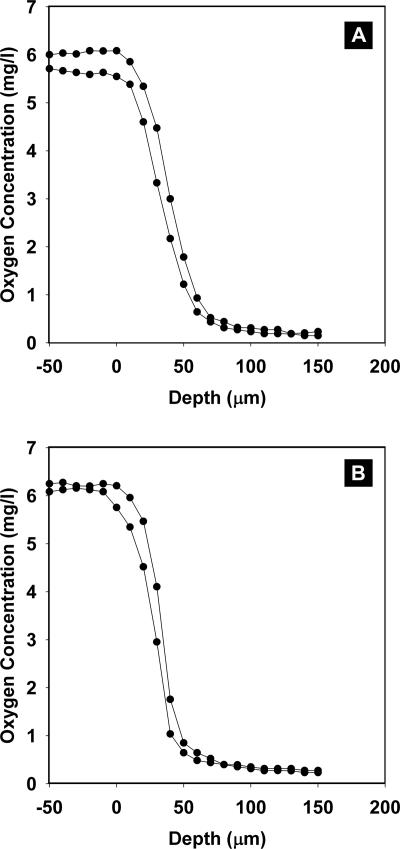
FIG. 5.
Oxygen concentration profiles in S. epidermidis (A) and S. aureus (B) colony biofilms. Zero on the x axis corresponds to the biofilm-air interface. Negative positions are in air, and positive distances are in the biofilm. Representative measurements from two different colonies are plotted in each panel.

