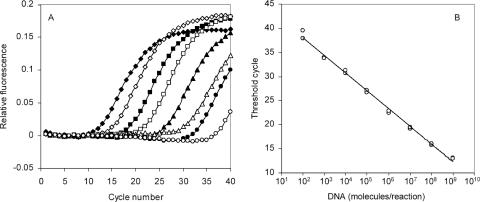
FIG. 2.
Real-time PCR analysis of C. abortus uvrD standard DNA. (A) Amplification plot of the C. abortus uvrD assay using serial, 10-fold dilutions of the puvrD plasmid as the template. ⧫, 109 plasmid DNA molecules/reaction; ⋄, 108; ▪, 107; □, 106; ▴, 105; ▵, 104; •, 103; ○, 102. The amplification plots are representative and illustrate, for each template concentration, the change in fluorescence as the PCR cycle number increases incrementally. (B) Standard curve derived from data presented in panel A. The cycle threshold (CT) for each reaction is the cycle number at which a fixed threshold value of relative fluorescence is attained in the amplification plot. Standard curves of the CT versus the number of DNA molecules/reaction were used to calculate unknowns. Standard reactions were performed in duplicate.

