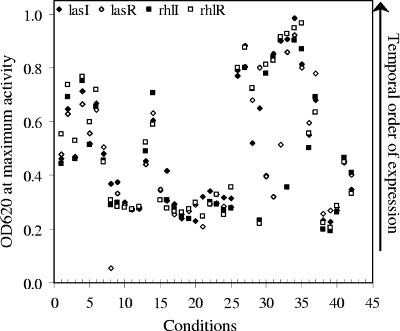
FIG. 4.
Distribution of cell densities at which maximum QS gene expression was observed under 42 growth conditions. Shown are the OD values at which the maximal expression of each gene for each condition was plotted. The 40 conditions presented in Table 1 as well as growth in the presence of CF sputum extracts at two concentrations (Fig. 6) are presented. Solid diamonds, open diamonds, solid circles, and open circles represent data for lasI, lasR, rhlI, and rhlR, respectively.

