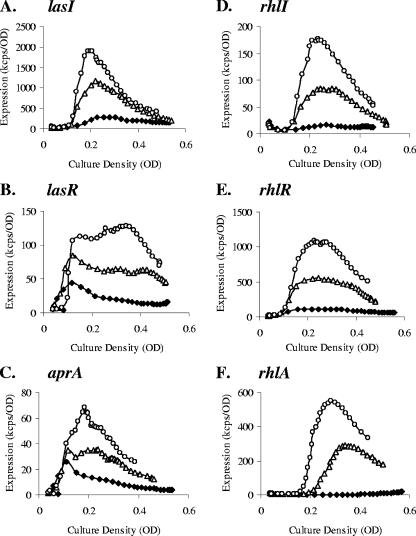
FIG. 6.
Activation of QS gene expression by sputum extracts. The expression profiles of the promoter-reporter fusions were measured every 30 min for 30 h at 37°C in M9 minimal medium with glucose. The data are presented as cps × 10−3 (kcps) normalized to OD620. Panels A to F represent the profiles of lasI, lasR, aprA, rhlI, rhlR, and rhlA, correspondingly. Diamonds, triangles, and circles represent no addition, 2.5% sputum extract, and 5% sputum extract, respectively. Only every second data point is shown.

