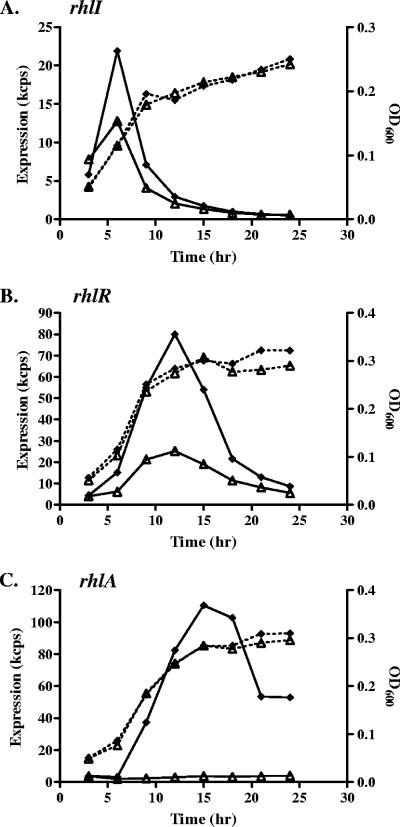
FIG. 7.
Expression profiles of rhlI, rhlR, and rhlA under microaerophilic conditions and the effect of NaCl. The expression profiles of the promoter-reporter fusions were measured every 3 h. The cultures were placed in an anaerobic jar and incubated at 37°C. (A) rhlI; (B) rhlR; (C) rhlA. Diamonds and open triangles represent expression with no addition and addition of 100 mM NaCl, respectively. The data are presented as cps × 10−3 (kcps) and are not normalized. Growth curves are represented by dashed lines.

