FIG. 6.
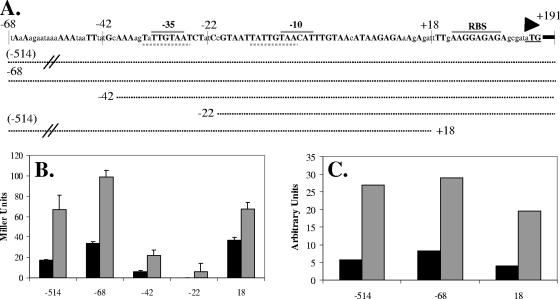
Dissection of the yoeB promoter region. (A) Schematic of yoeB promoter region. Capital letters designate bases that are identical in B. subtilis 168, B. licheniformis 14580, and B. amyloliquefaciens FZB45. Conserved −35 and −10 promoter elements and the ribosome binding site (RBS) are indicated by gray overlines, the start of translation is shown by a triangle, and dashed underlines show the conserved 8-bp direct repeat. Dotted lines represent promoter fusions. (B) β-Galactosidase assay for induction of various promoter fusions by vancomycin (2 μg/ml) (gray) compared to uninduced controls (black). Results are representative of two independent experiments and are the average of two independent samples. (C) Graphic representation of RNA slot blot analysis for expression of PyoeB-lacZ. RNA samples extracted from strains containing the different promoter fusions and either left uninduced or induced with 10 mM diamide were applied to the blot. The blot was hybridized with a probe for lacZ, and the resulting signals were quantified with the ImageQuant data analysis software. The results are representative of two independent experiments.

