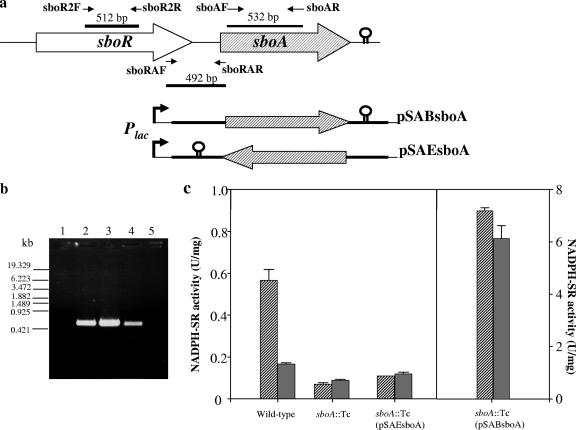
FIG. 5.
Transcriptional organization of sboRA genes and examination of promoter activity in the intergenic region. (a) Schematic representation of the orientation of genes, indicated by large arrows. Thin arrows show the position and direction of the primers used, and the thick bars indicate the regions amplified by the primer pairs. Also shown is the gene region carried by pSA19 for the complementation of sboA in the same or opposite direction from that of the lac promoter, resulting in plasmid pSABsboA or pSAEsboA, respectively. (b) Agarose gel analysis of RT-PCR amplification products. The primer sets used for RT-PCR were sboR2F and sboR2R (lanes 1 and 2), sboAF and sboAR (lane 3), and sboRAF and sboRAR (lanes 4 and 5). Lanes 1 and 5 contain samples in which reverse transcriptase was omitted. (c) NADPH-SR activity in soluble fractions from wild-type and mutant strains grown on d-sorbitol medium (hatched bars) and glycerol (gray bars).

