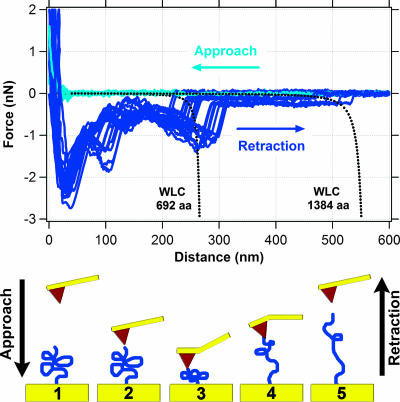
FIG. 3.
Measurements of force between hematite and MtrC. The top graph shows 14 approach (light blue) and 14 retraction (dark blue) force curves. The dotted black lines correspond to the theoretical force-extension relationship for polypeptides composed of 692 (single MtrC molecule) and 1,384 (putative MtrC dimer) amino acids as predicted by the WLC model (equation 2). The bottom schematic illustrates one approach/retraction cycle, starting at frame 1 and ending at frame 5.

