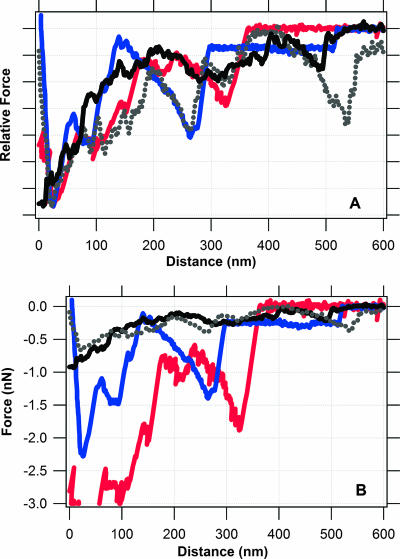
FIG. 8.
Spectra for force-distance relationship between an Fe(III) oxide and either a purified cytochrome or S. oneidensis MR-1. Traces correspond to retraction curves for an Fe(III) oxide and each of the following: S. oneidensis MR-1 grown with Fe(III) as the terminal electron acceptor (black and gray curves), recombinant MtrC (blue curve), and recombinant OmcA (red curve). Curves for the purified cytochromes come from this study. The solid black curve was taken from reference 32, and the dotted gray curve was taken from reference 29. (A) Relative force-distance spectra where the y axis has been normalized such that the maximum force in each retraction curve is set to a value of 1. This procedure does not alter the distance data; it simply plots force on a relative scale. (B) Unaltered versions of the force spectra presented in panel A for comparison.

