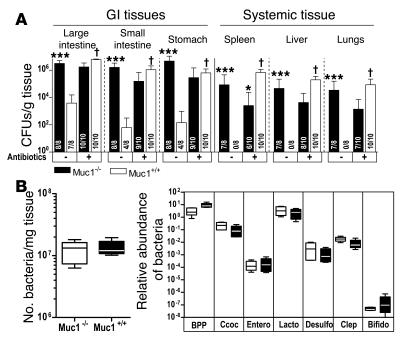
Figure 6. Reduced bacterial flora increases susceptibility of Muc1+/+ mice to C. jejuni infection, but bacterial flora is not altered in Muc1–/– mice.
(A) Concentrations of C. jejuni in gastrointestinal and systemic tissues of Muc1–/– and Muc1+/+ 129/SvJ mice after oral inoculation with 105 C. jejuni strain 81116 with (+) and without (–) treatment with broad spectrum oral antibiotics for 7 days. Antibiotics were withdrawn 24 hours prior to inoculation. Mean ± SD of CFUs/g tissue. Colonization frequency is shown at the base of each histogram. ANOVA, Tukey’s post-hoc test; *P < 0.05, Muc1–/– versus Muc1+/+; ***P < 0.001, Muc1–/– versus Muc1+/+; †P < 0.001, antibiotics versus control. (B) Number of bacteria in the entire large intestine was estimated by counting SYBR green–stained bacteria on filtered fixed tissue homogenates. DNA was extracted from feces of Muc1–/– and Muc1+/+ mice and quantitative PCR used to amplify 16S ribosomal DNA and quantify the abundance of major intestinal bacterial groups. BPP, Bacteroides-Prevotella-Porphyromonas group; Ccoc, C. coccoides group; Entero, Enterococcus spp; Lacto, Lactobacillus group; Desulfo, Desulfovibrio group; Clep, C. leptum subgroup; Bifido, Bifidobacterium genus. Results in individual mice were expressed as a proportion of the result for universal bacterial 16S ribosomal DNA primers. Box plots show medians, quartiles, and ranges.

