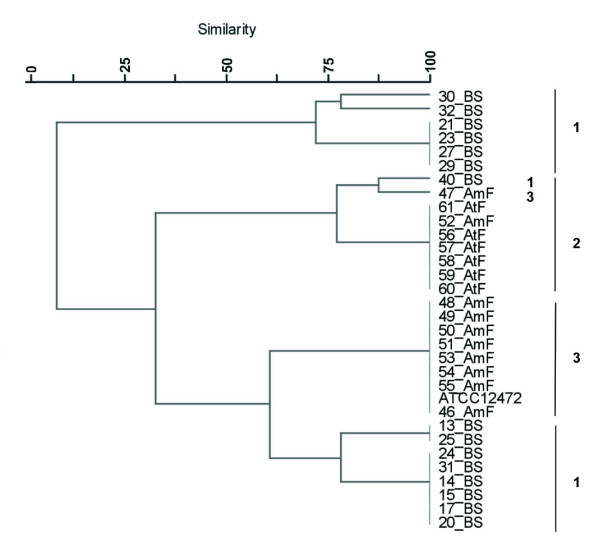
Figure 5.

Cluster analysis of Chromobacterium sp. isolates and of C. violaceum ATCC 12472 according ARDRA profiles. A distance matrix of simple similarity coefficients was clustered with the UPGMA algorithm. Numbers 1 to 3 identify the 16S rDNA sequence based phylogeny clusters obtained with the Chromobacterium sp. isolates.
