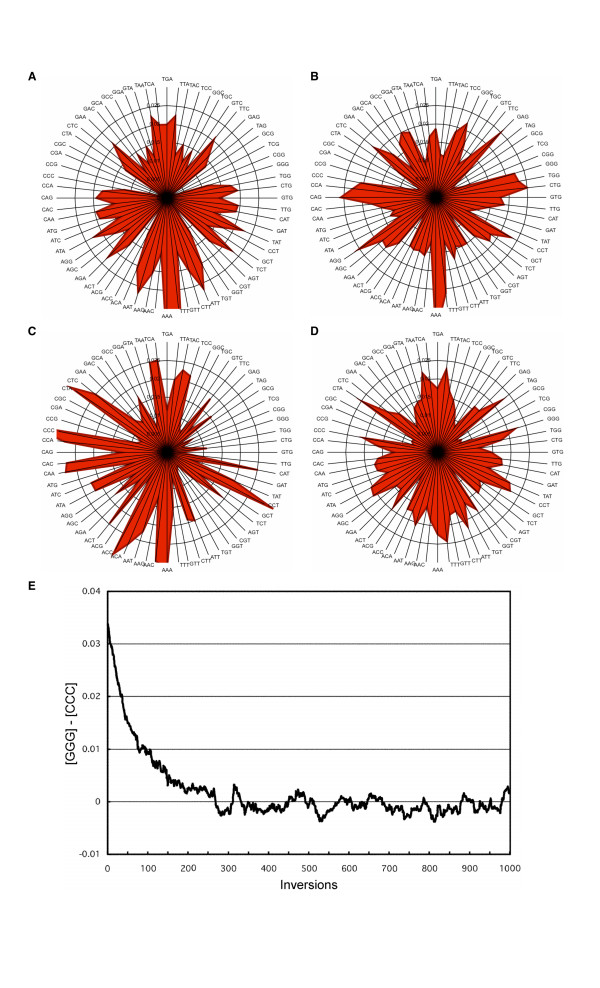
Figure 2.

Intra-strand parity visually represented by radar charts. Frequencies of trinucleotides in various DNA sequences are shown here. Each trinucleotide is sorted alphabetically from bottom to top (left side). The corresponding complementary trinucleotides are arranged across to the right. A, Radar chart representing a fully sequenced contig (NT_010966, 33,548,238 bp) of human chromosome 18. This contig is continuous and does not include any annotated gaps or ambiguous nucleotides. The symmetrical chart shows the equal frequencies of specific oligonucleotides and their reverse complementary oligonucleotides. The high frequencies of poly-A and poly-T, which might be, in part, traces of retrotranspositions of poly-A+ mRNA, and the deficiencies of trinucleotides that contain the CpG dinucleotide make the stalk and four grooves, respectively, of the "maple leaf" shape. (The shapes vary slightly based on the genome sequence analyzed, but the general symmetry is maintained). B, The genomic sequence of the p53 (TP53) locus (U94788, 20,303 bp). The symmetry is roughly retained in sequences as short as 20 kb in length. The protein-coding sequences occupy 5.8% of this locus. This chart also suggests that transcriptional asymmetry is small in magnitude. C, Human mtDNA. The asymmetry illustrates that this DNA does not show intra-strand parity. D, Human mtDNA after inversion in silico. It becomes symmetrical, demonstrating that inversions can change a sequence to create the parity. In this case, each rn approximates to 1/16.6. This also demonstrates that only 1/(2rave) inversions (eight inversions in this case) are enough to make a sequence conform to parity. E, The difference of frequencies of GGG and CCC ([GGG] - [CCC]) in human mtDNA approaches 0 by in silico random inversions. In this analysis, for simplicity, the size of each inversion was fixed to 100 bp. In human mtDNA, GGG and CCC have the largest difference of frequencies among all trinucleoties (see Fig. 2C).
