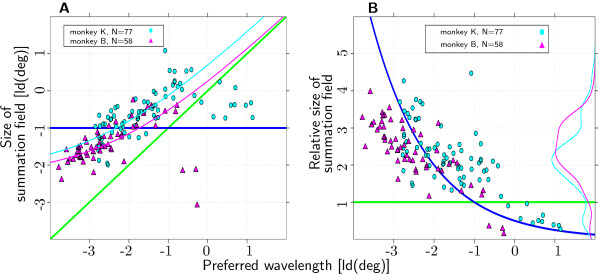
Figure 3.

Preferred Wavelength and ΣRF. Joint distribution of preferred spatial wavelength and summation field size (135 out of 152 recorded channels; two monkeys, 1 hemisphere each). Dark blue line: model of constant ΣRF size. Green line: model of ΣRF size scaled with preferred spatial wavelength. (A) Preferred spatial wavelength and absolute summation field size show a significant positive correlation for both monkeys. Pink and light blue line: fit of the model with additive term as described in Discussion. (B) Preferred wavelength and relative summation field size show a significant negative correlation for both monkeys. Pink and light blue line: marginal distributions of relative summation field size.
