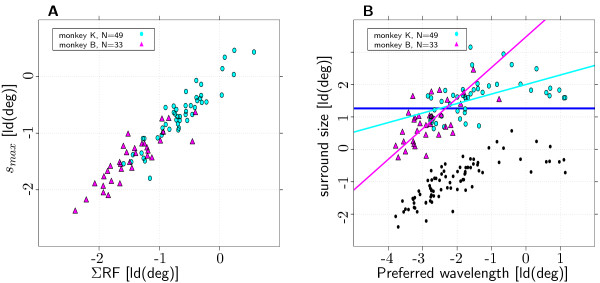
Figure 5.

Preferred Wavelength and surround size. ΣRF and surround size measures from the DOG method. (A) Comparison of ΣRF size estimated with the bootstrap and the DOG method. The two measures are highly correlated (see text for details). (B) Joint distribution of preferred spatial wavelength and surround size (82 out of 152 recorded channels; two monkeys, each 1 hemisphere). Dark blue line: model of constant surround size. Preferred spatial wavelength and surround size show a significant positive correlation for both monkeys (see text for details). Pink and light blue line show the regression lines calculated via principal component analysis for monkey K and B, respectively. The black dots show the corresponding ΣRF sizes.
