
Fig. 7.
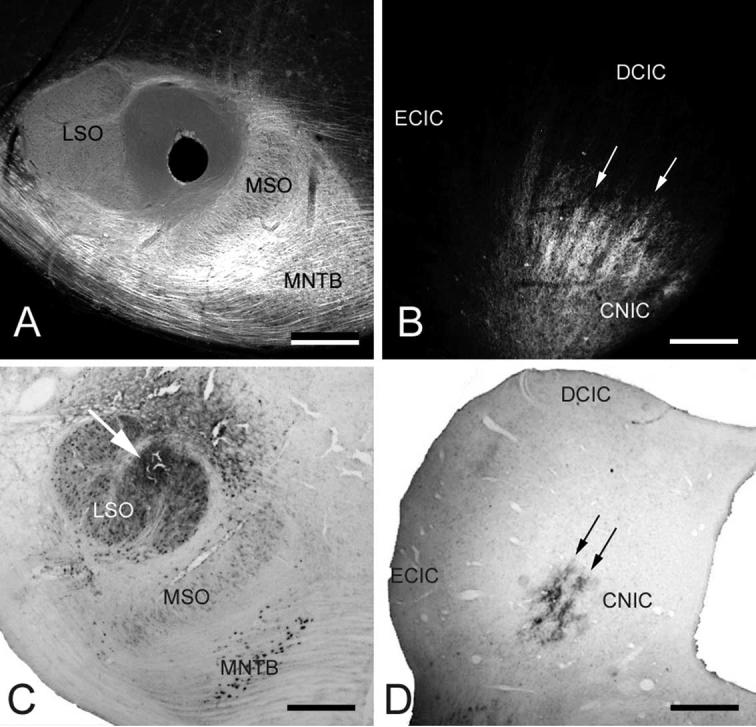
Digital photomicrographs illustrating LSO tracer placements and labeled LSO projections to the ipsilateral CNIC. (A) Frontal section through P1 kitten superior olivary complex showing position of DiI-coated pin (hole) in the medial LSO. (B) Digital image of epifluorescent DiI-labeled axonal bands (arrows) in the CNIC. (C) Frontal section through adult cat superior olivary complex showing position of WGA-HRP injection (arrow) in medial LSO. (D) Brightfield digital photomicrograph of labeled axons ending in bands (arrows) in the CNIC. Scale bars=0.33 mm, A; 0.33 mm, B; 0.5 mm, C; 1 mm, D.