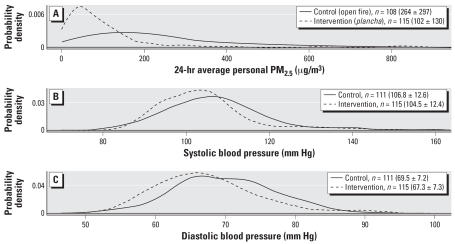
Figure 1.
Between-group comparisons. Smoothed probability densities by randomized stove group (control, n = 71; intervention, n = 49) during the trial period (June 2003 through December 2004) of (A) 24-hr average PM2.5; (B) SBP; and (C) DBP. Mean ± SD for each distribution shown in parentheses next to number of repeated measures (n).

