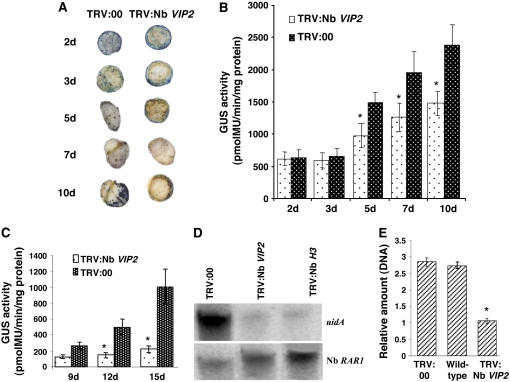
Figure 3.
Transient Transformation and T-DNA Integration Assays in Nb VIP2–Silenced Plants.
(A) Transient transformation assay. Leaf disks of the Nb VIP2–silenced and TRV:00 plants were inoculated with nontumorigenic strain A. tumefaciens GV2260 carrying pBISN1 (has the uidA-intron gene within the T-DNA). The inoculated leaves were periodically collected and stained with X-Gluc.
(B) Quantification of GUS activity. Leaf disks from the experiment in (A) were collected periodically and were used for measuring the fluorescence of 4-methylumbelliferone (4-MU).
(C) T-DNA integration assay. Leaf disks from TRV:00 and Nb VIP2–silenced plants were inoculated with Agrobacterium strain carrying a promoterless uidA-intron gene and 35S:luc-intron gene within the T-DNA. Leaf disks were periodically collected, and GUS activity was measured as described above.
(D) T-DNA integration in the Nb VIP2–silenced and TRV:00-infected plants. Suspension cells were derived from the calli generated from Nb VIP2–silenced and TRV:00-infected leaf segments infected with the nontumorigenic strain A.tumefaciens GV2260 carrying pBISN1. The suspension cell lines were grown for 8 weeks in nonselective medium. Genomic DNA was isolated from these cells, subjected to electrophoresis through a 0.8% agarose gel, blotted onto a nylon membrane, and hybridized with a uidA gene probe. After autoradiography, the membrane was stripped and rehybridized with the Nb RAR1 gene probe to compare the amount of DNA in each lane.
(E) Quantification of T-DNA integration. The amounts of integrated T-DNA molecules in the genomic DNA extracted from calli that were generated from leaf disks transformed with the Agrobacterium strain carrying the uidA-intron gene within the T-DNA were measured by quantitative PCR. The uidA gene transcripts in calli derived from Nb VIP2–silenced plants are represented in relative amounts in comparison to an average T-DNA amount in the calli derived from wild-type and TRV:00 plants. All the experiments were done with at least five biological replicates and repeated two times. Asterisks in (C) and (E) denote value that are significantly different between the two treatments by analysis of variance at P = 0.05. The data represent the average of five biological replicates in two experiments with se values shown as error bars.

