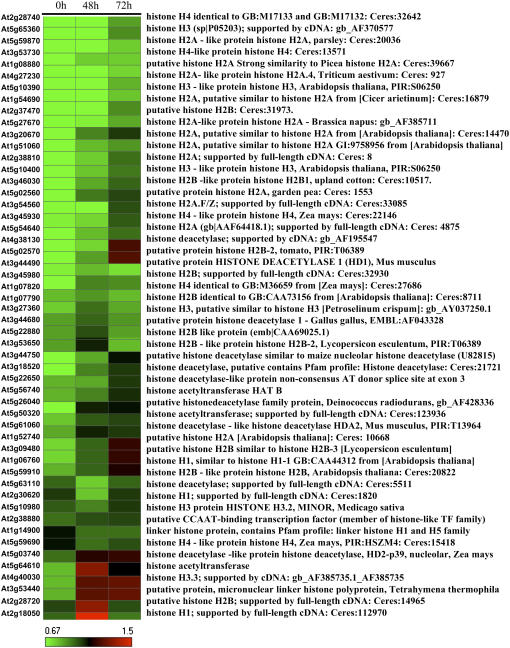
Figure 7.
Expression Profile for the 52 Differentially Expressed Histone or Histone-Associated Genes Represented in the ATH1 Gene Chips in Col-0 and At vip2.
Color code represents expression values of ratio between At vip2 and Col-0, wherein red and green indicate up- and downregulation of genes, respectively. Each horizontal line displays the expression data for one gene. Data were clustered with correlation using the TIGR Multiple Experiment Viewer.

