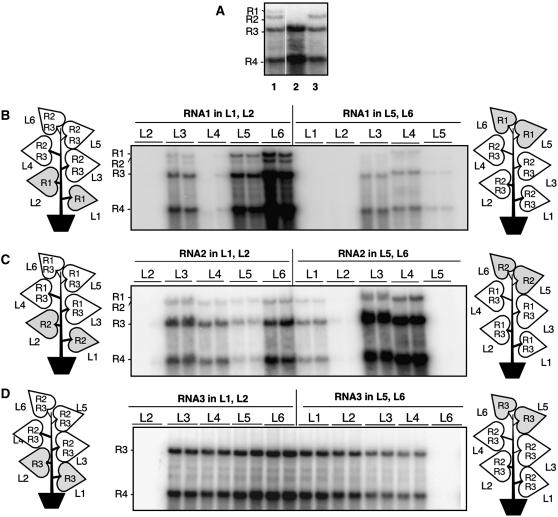
Figure 6.
The Leaf Position Where BMV RNAs Were Initially Expressed Affected RNA Trafficking.
(A) Three samples of replicated BMV RNAs to aid in the identification of the RNAs.
(B) Trafficking of BMV RNA1 when initially expressed in the bottom two leaves (L1 and L2) or the top two leaves (L5 and L6) of the plants. The schematics of N. benthamiana plants denote the locations where BMV constructs were infiltrated. The leaves in gray denote the location where the RNAs of interest were infiltrated. The leaves from which the RNA samples were isolated are identified above the image of the RNA gel blot probed to detect (+)-strand BMV RNAs. The identities of the bands are shown to the left of the autoradiogram images.
(C) Trafficking of BMV RNA2 when initially expressed in the bottom two leaves (L1 and L2) or the top two leaves (L5 and L6) of the plants. The layout of this panel is identical to that of (B).
(D) Trafficking of BMV RNA3 when initially expressed in the bottom two (L1 and L2) or the top two leaves (L5 and L6) of the plants.

