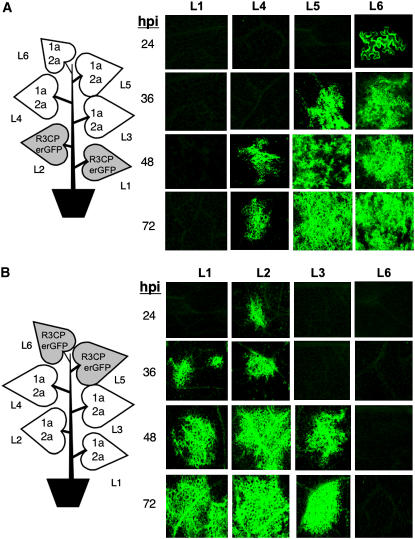
Figure 7.
Directional Trafficking of R3CPerGFP.
(A) Trafficking of R3CPerGFP infiltrated in the bottom two most mature leaves of the plant. The schematic of the plant indicates the locations where the BMV components were expressed by agroinfiltration. The shaded leaves denote the source of the RNA that expresses ERGFP. The fluorescent micrographs were taken at the hour after infiltration (hpi) indicated. All the images were taken at ×5 magnification, except L6, which was at ×40 magnification.
(B) Trafficking of R3CPerGFP expressed by agroinfiltration in the top two leaves of the plant.

