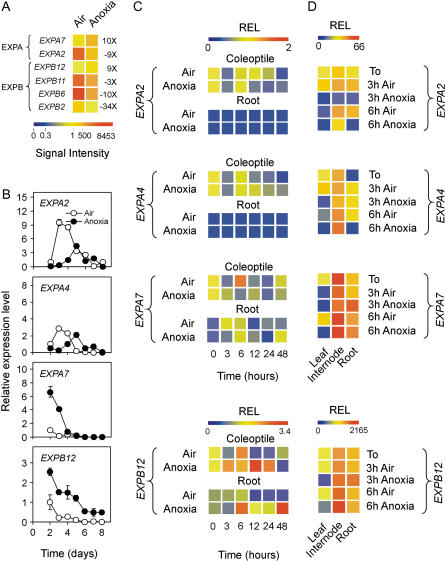
Figure 4.
Effects of anoxia on expansin gene expression. A, Pattern of expression of the expansin genes differentially regulated by anoxia; data are expressed as a heat map showing the signal intensity from the microarray experiment (data are means of two GeneChip experiments) performed on coleoptiles from rice seeds germinated in air and anoxia for 4 d. Fold change is shown on the right side of the heat map (FDR P value < 0.01). TIGR gene codes are as follows: EXPA2 = Os01g60770; EXPA7 = Os03g60720; EXPB2 = Os10g40710; EXPB6 = Os10g40700; EXPB11 = Os02g44108; and EXPB12 = Os03g44290. B, Pattern of expression of expansin genes EXPA2, EXPA4 (Os05g39990), EXPA7, and EXPB12 in the coleoptiles from rice seeds germinated in air and anoxia; relative expression level (REL), measured by real-time reverse transcription (RT)-PCR, is shown (REL, 1 = expression data from the aerobic coleoptile at day 2); data are means of three replicates ±sd. C, Pattern of expression of the expansin genes EXPA2, EXPA4, EXPA7, and EXPB12 in the coleoptiles and roots from rice seeds germinated in air for 4 d and then transferred to anoxia for an additional 48-h period; REL, measured by real-time RT-PCR, is shown as a heat map (REL, 1 = expression data from the aerobic coleoptile at the beginning of the experiment, t = 0); data are means of three replicates (see Supplemental Table S3 for ±sd values). D, Pattern of expression of the expansin genes EXPA2, EXPA4, EXPA7, and EXPB12 in the leaves, internodes, and roots from rice plants grown in air for 20 d and then transferred to anoxia for an additional 3- to 6-h period; REL, measured by real-time RT-PCR, is shown as a heat map (REL, 1 = expression data from the aerobic leaf at the beginning of the experiment, t = 0); data are means of three replicates (see Supplemental Table S3 for ±sd values).

