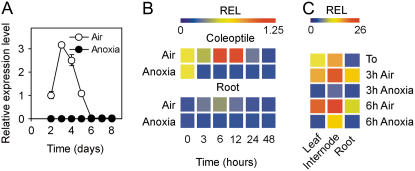
Figure 9.
Effects of anoxia on catalase gene expression. A, Pattern of expression of the Os02g02400 gene in the coleoptiles from rice seeds germinated in air and anoxia; relative expression level (REL), measured by real-time reverse transcription (RT)-PCR, is shown in the graph (REL, 1 = expression data from the aerobic coleoptile at day 2); data are means of three replicates ±sd. B, Pattern of expression of the Os02g02400 gene in the coleoptiles and roots from rice seeds germinated in air for 4 d and then transferred to anoxia for an additional 48-h period; REL, measured by real-time RT-PCR, is shown as a heat map (REL, 1 = expression data from the aerobic coleoptile at the beginning of the experiment, t = 0); data are means of three replicates (see Supplemental Table S3 for ±sd values). C, Pattern of expression of the Os02g02400 gene in the leaves, internodes, and roots from rice plants grown in air for 20 d and then transferred to anoxia for an additional 6-h period; REL, measured by real-time RT-PCR, is shown as a heat map (REL, 1 = expression data from the aerobic leaf at the beginning of the experiment, t = 0); data are means of three replicates (see Supplemental Table S3 for ±sd values).

