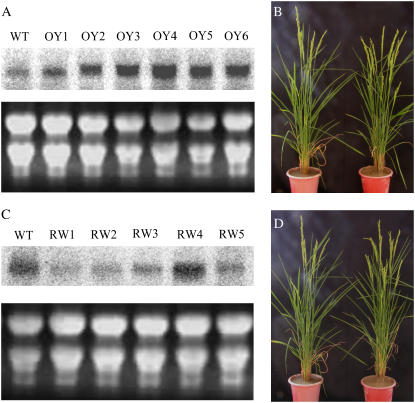
Figure 6.
Analysis of YAB3 overexpression and WOX3 RNAi plants. A, Expression analysis of YAB3 in wild-type (WT) and five independent YAB3 overexpression transgenic lines (OY1–OY6). B, Comparison of wild type (left) to the YAB1 overexpression transgenic line OY6 (right). C, Expression analysis of WOX3 in wild-type (WT) and five independent WOX3 RNAi transgenic plants (RW1–RW5). D, No phenotypic change observed in RW1 (right) compared to wild type (left). [See online article for color version of this figure.]

