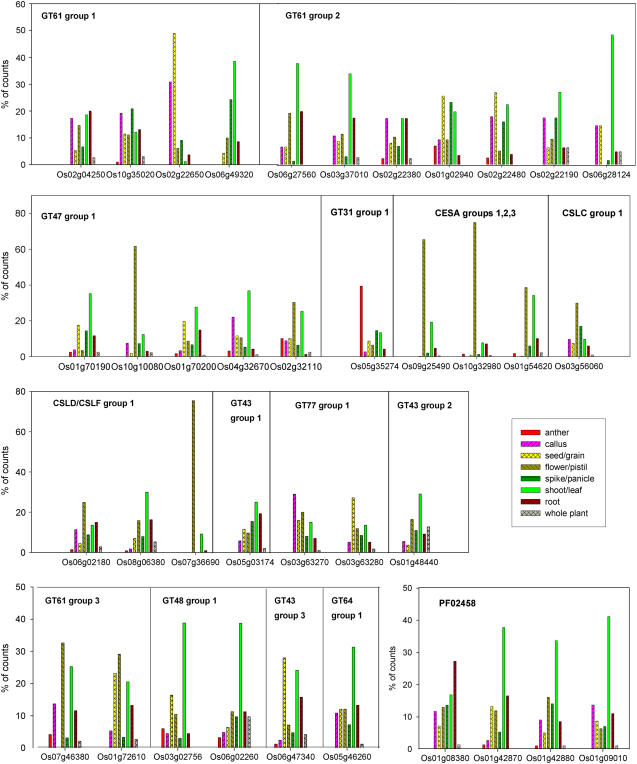
Figure 1.
Tissue distribution of cereal EST counts for rice loci with 50 or more cereal ESTs in orthologous groups from Table I. Only counts from libraries with tissue information are included and data are presented as a percentage of the total of these for each locus.

