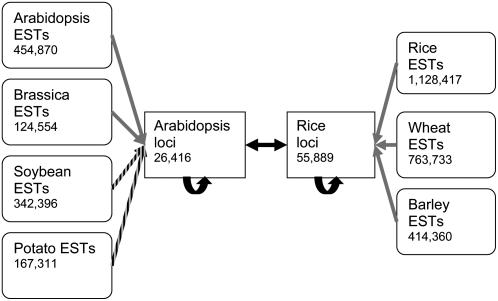
Figure 2.
Scheme for mapping of ESTs to genes by sequence similarity. Arabidopsis-rice loci relationships were defined by protein similarity searches (black arrows; BLASTp with bits score >200). The closest matching rice or Arabidopsis gene for every EST was identified by nucleotide similarity search (grey arrow; BLASTn with E < 10−5) or translated nucleotide similarity search (striped arrow; BLASTx with E < 10−5). Number of sequences are indicated.

