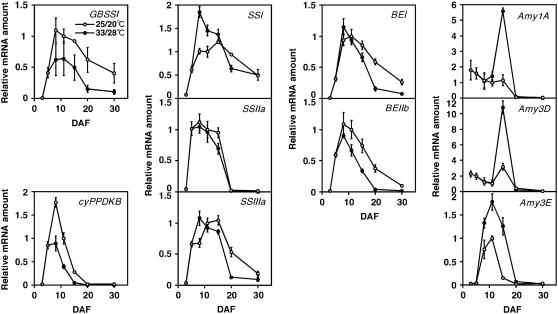
Figure 3.
Comparison of expression of genes for SSs, BEs, and α-amylases, and cyPPDKB. The expression levels were determined by semiquantitative RT-PCR analysis and densitometry, and the value of 25°C/20°C, 11 DAF was set to “1” for each gene. Results from four independent PCRs are shown with error bars (sd).

