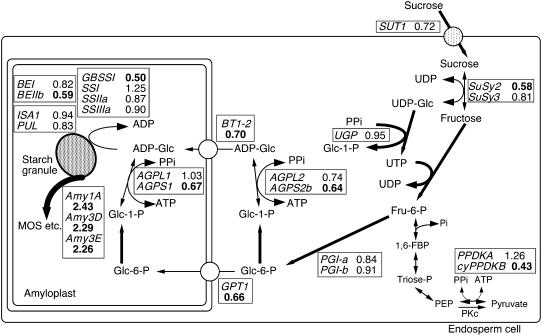
Figure 8.
Ratio of cumulative expression level during 8 to 30 DAF of starch metabolism-related genes. The cumulative expression levels during 8 to 30 DAF were determined by semiquantitative RT-PCR and densitometry for grain filling under 25°C/20°C and 33°C/28°C, as described in the legend of Figure 2, and the ratio of cumulative transcript level for 33°C/28°C to 25°C/20°C is shown for the respective genes encoding enzymes/translocators on the starch-metabolizing pathway. The genes induced >1.5-fold and the corresponding reaction step are indicated in bold and with a thick arrow, while the genes repressed to <0.70-fold and the corresponding steps are indicated in bold and with thin arrows. The products of AGPL1 and AGPS1 genes have been estimated to be localized in amyloplasts, while those of AGPL2 and AGPS2b in the cytosol (Akihiro et al., 2005; Ohdan et al., 2005). The pathways described in the text are solely depicted. MOS, Maltooligosaccharide; PKc, cytosolic pyruvate kinase.

