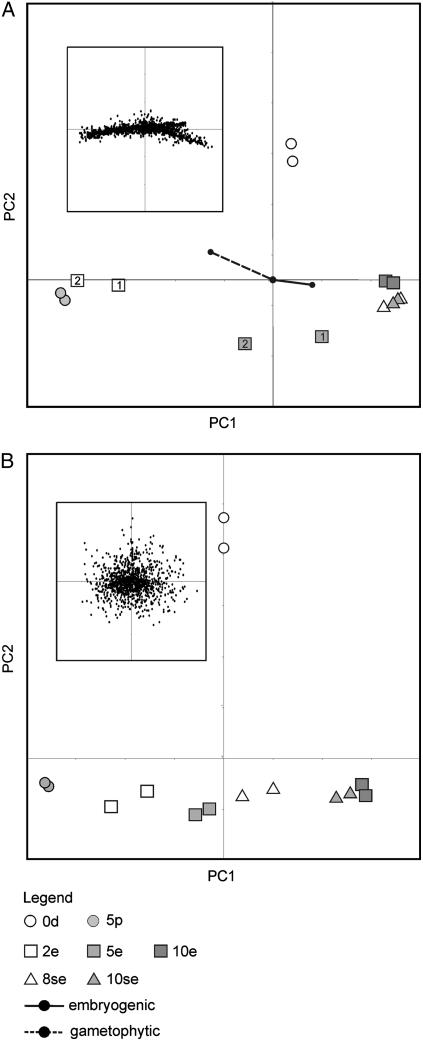
Figure 3.
PCA of gene and protein expression profiles detected in rapeseed pollen and MDE cultures. PCA plots of gene (A) and protein (B) expression profiles are shown. For both plots, the replicated culture samples/pools are indicated. For the PCA plot of the gene expression profiles, culture 1 and culture 2 are indicated as 1 and 2, respectively. For each plot, the corresponding distribution of genes or proteins is shown in the inset. The composition of the analyzed samples in terms of the percentage of gametophytic and embryogenic structures was incorporated into the plot of the gene expression profiles (vectors). 0d, Starting microspore culture; 5p, 5-d pollen culture; 2e, 2-d conventional MDE culture; 5e, 5-d conventional MDE culture; 10e, 10-d conventional MDE culture; 8se, 8-d suspensor-bearing MDE culture; 10se, 10-d suspensor-bearing MDE culture.

