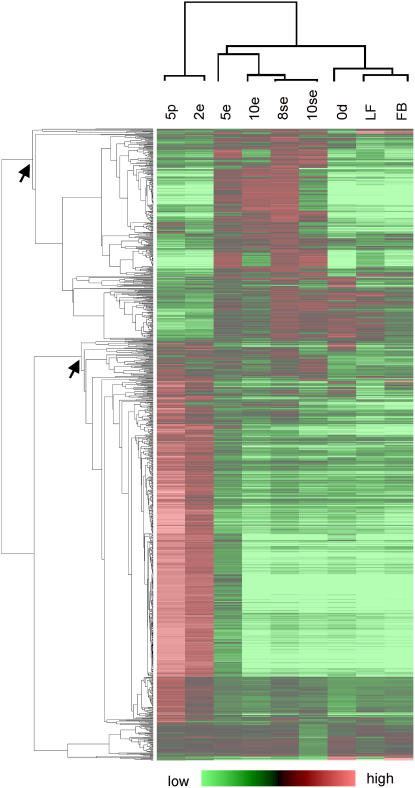
Figure 4.
Hierarchical cluster analysis of the expression profiles of rapeseed probes expressed in freshly isolated microspores, pollen cultures, or MDE cultures. The columns represent the samples and the rows the individual probes. Probes that are up- or down-regulated compared to the common reference are indicated in red and green, respectively. The intensity of the colors increases with increasing expression differences, as shown in the bar at the bottom. The pollen and embryo up-regulated clusters are indicated with arrows. Only probes for which an expression ratio for both culture samples could be calculated were included in the analysis (1,059 probes). 0d, Starting microspore culture; 5p, 5-d pollen culture; 2e, 2-d conventional MDE culture; 5e, 5-d conventional MDE culture; 10e, 10-d conventional MDE culture; 8se, 8-d suspensor-bearing MDE culture; 10se, 10-d suspensor-bearing MDE culture. LF, Mature leaves; FB, flower buds (3–4 mm).

