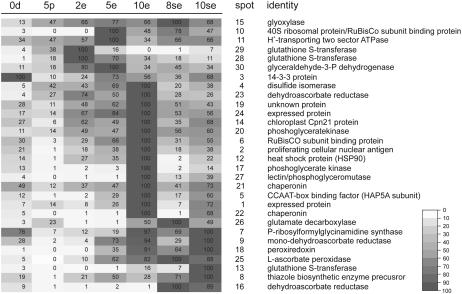
Figure 7.
Heat map of the relative signal intensities of proteins expressed in rapeseed pollen and MDE cultures. Signal intensities for each protein spot were normalized to the highest signal intensity for that protein spot (100%) in the culture series. Values shown are relative (i.e. they do not reflect the absolute expression levels of the proteins in the samples). The heat map was created in GeneMaths, version 2.01 (Applied Maths). The color-code bar is shown on the right. Sample legend as in Figure 3.

