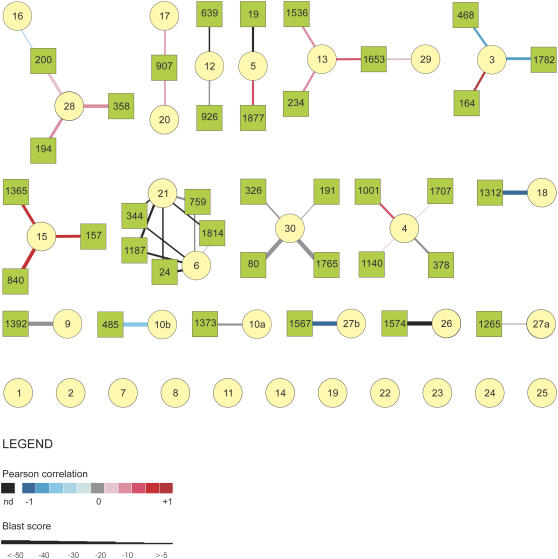
Figure 8.
Integration of sequence and expression data obtained from transcriptome and proteome analyses of rapeseed pollen and MDE development. In the network, the nodes represent the cDNA probes (circles) and protein spots (squares), whereas the line connecting the nodes represents the sequence similarity between the protein and cDNA sequences. The sequence similarity is indicated by the thickness of the lines (see inset). The similarity in expression profiles is represented by the color of the connecting lines (see inset). The assigned probe and protein numbers are shown inside the nodes. The cytoscape output is shown in Supplemental Table S5.

