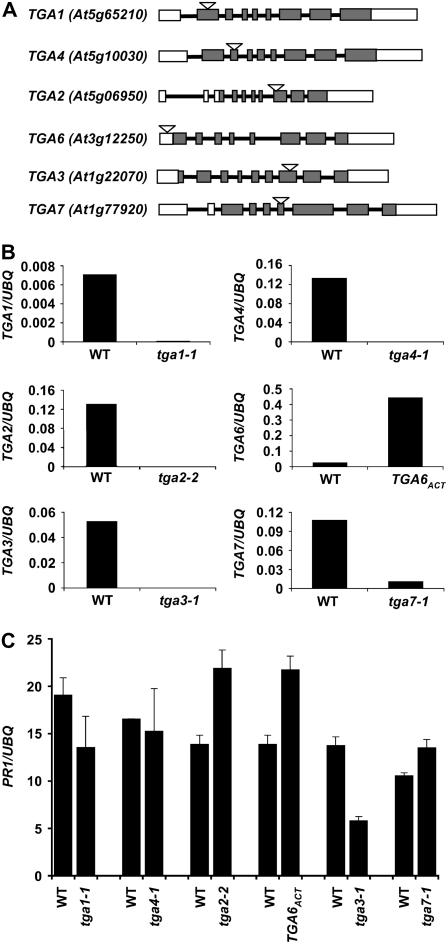
Figure 1.
Characterization of tga T-DNA insertion mutants. A, Schematic representations of different tga T-DNA insertion mutations. Arabidopsis Genome Initiative numbers of the genes are shown in parentheses. Rectangular boxes represent the exons, whereas the interconnecting lines represent the introns. White rectangles show the untranslated regions in the genes. The T-DNA insertion site is represented as a triangle above each gene. B, Real-time RT-PCR analysis of TGA gene expression in the mutants. RNA was extracted from 2-week-old seedlings grown on a Murashige and Skoog plate. The individual bar diagrams shows the relative amount of the transcript of the corresponding TGA gene in the wild type and mutant normalized to the levels of a UBQ gene. The normalized values were multiplied by 1,000 for TGA2, TGA3, TGA4, and TGA7 and by 10 for TGA4. C, Expression of PR1 in each tga mutant was determined from 2-week-old seedlings harvested from Murashige and Skoog plates containing 20 μm INA using real-time RT-PCR. The y axis values are normalized to UBQ5 expression. Error bars represent se. The experiments were repeated at least three times with similar results. WT, Wild type; UBQ, ubiquitin.

